Tuesday, August 25, 2020

Where does the negative leading phase come from?

I've previously observed phenomena I've labeled phase lead.  The response of all speakers I've measured, except for supertweeters (which have different phenomena), is marked by a leading negative phase portion in response to a square transient pulse.

This leading negative phase portion seems to last about 4ms for both my subwoofer and my panels under some conditions.  Sometimes I remembered or mis-remembered seeing much less from the panels, but the latest set of measurements in the previous post shows the phase lead portion uniformly at around 4ms.

I started by looking at the drive signal to the subwoofers, which I captured from the analog outputs of my Behringer 2496 EQ.  My system actually uses the digital outputs, which are routed to an Emotive Stealth DC-1.  For the purposes of an initial test, I decided the analog outputs of the Behringer (different DAC chip and circuitry) were close enough.  (I tried to connect to the unused single ended outputs of the Emotiva, but it was clear I could not do that without disconnecting a bunch of other things to get at it.  So I chose an easier test, which might use some revisiting later.)


Electrical signal to left Subwoofer

Notice how the electrical version of the transient pulse sort of looks like a transient pulse with a flat top, but very sloped instead of square sides.  But it doesn't take too much careful examination to see the negative phase lead, from about 78.5 to 82.5 ms.  (These do not include the final acoustical delay and others, so they are about 20ms less than the microphone measurements posted before.)

One troubling thing, however is the low amplitude of the phase lead relative to the transient top.  It appears to have at most 1/10th the amplitude.  I thought I remembered seeing far more than that.  Let's take a look at the left subwoofer transient measurement a few days earlier.

Left Subwoofer Output at Listening Position

Well, maybe not.  Here again the phase lead of about 4ms total duration appears to have about 1/10 or less of the magnitude of the bass peak.

I next decided to look at the output of the midrange DEQ in response to the transient.

Midrange electrical signal

Once again, we see about a 4ms phase lead, which in this case might be preceded by another 4ms positive phase phase lead lead.

Hoping for less confusion, I turned off the minimal EQ I apply in the midrange DEQ itself, so as to see only the effect of the linear phase LR8 crossover in the miniDSP unit preceding the DEQ:


Not any obvious differences.  I then tried bypassing the linear phase crossovers.

Now this has really changed things.  I'm shocked how fast the top of the transient collapses.  Did I somehow not bypass the highpass filter (bass crossover)?  But with regards to the phase lead, it has radically changed.  Now it lasts 0.2ms instead of 4ms.  But, and very strangely, the magnitude looks even larger than 10%, maybe as much as 20%.

 To bypass the EQ chain entirely, including the crossovers in the miniDSP's, I then looked at the analog output of my Tact digital preamplifier.  I do not use this output, I use the AES digital output which feeds all my EQ processors.  However, it's a very high quality analog balanced output, suitable for a $5k premap in 2000, which should mirror the unprocessed digital output signal about as close as can be done.

The short duration phase lead as we saw with crossovers bypassed is still there!  What about the output of the Focusrite 2i4 itself?  I did a loopback using an unbalanced cable with a 1/4 phone plug into the input of the Focusrite and got this:

Well, darned if it doesn't also have the short phase lead I started to see after bypassing the crossovers.

The current conclusion is:

1) I see the phase lead in everything, including the Focusrite interface itself.

2) The phase lead after crossovers are applied get much longer in duration, from about 0.2ms to 4ms.

This may be phenomena which are found in everything to a greater or lesser degree, as with high frequency rolloff.  But the crossovers I'm using now make this much longer in duration, if slightly smaller in magnitude.  And I believe I've seen the issue with other crossovers also.

3) Since the phase lead from crossover appears identical for highpass and lowpass parts, it's OK either to align uniformly to the beginning of the phase lead, OR the beginning of the primary positive rise.  The latter is easier to read, AND gets past the possibility of phase lead lead which I've seen in some cases.


Sunday, August 23, 2020

Picturing the New Alignment

 As previously described, I've settled on something like the simplest alignment method for now.  Align for identical listening position wavefront alignment.  And for now, alining so that the positive wavefronts match, I'm ignoring some negative polarity phase lead which seems to come from every driver.  I am currently investigating what causes that.  All my drivers are nominally in polarity, and so where they begin positive polarity movement represents the true beginning (or so I believe now).

[Update: Days later I determined that it appears the phase lead seems to be an artifact of the Focusrite or the the ARTA program.  I see about 4ms delay in a pure loopback signal from the inputs to the outputs of the focusrite.  But I remember seeing a very similar phenomenon years ago using an EMU 0202 interface with REW program.  And the magnitude of the phase lead seems to be far lower in magnitude in the loopback measurement than it appears in these acoustic measurements.  I will show this in a subsequent post.  I'm still considering it a puzzle.  Anyway, for practical reasons, my current method of aligning to the first positive motion still works best because the beginning of the tiny phase lead is much harder to determine unambiguously due to its fairly low frequency and magnitude similar to low frequency room noise.  The beginning of the upwards motion is a signal change which is relatively well determined for all drivers and should measure identically from all drivers, though it emphasizes the higher frequencies passed by each driver rather than the lower frequencies, a topic that may be worth additional investigation sometime, though I use linear phase crossovers anyway, AND the higher frequencies are what's most important to align for the subwoofer anyway.]

Near the beginning of this series of measurements (for which the microphone might have been slightly nudged from previous measurements) I found a total latency of 98.396 ms for the panels (including the standard 10ms delay I have dialed in to the midrange DEQ).  There also seemed to be about 4ms of phase lead, with an extra little drop before the rise which may be about 0.2ms which I had previously believed to be all of the phase lead.  But I have decided mostly to ignore the phase lead for now.  For most of the screenshots I set the yellow cursor to the exact point of the beginning of positive movement, so you can read the number at the bottom of the graph.

For the supertweeter, I measured a delay of 98.458ms, ignoring a tiny bit of pre-ringing, and also the chair reflction about 2ms later.

For the subwoofer, which had been previously aligned using the now discredited "maximum summed amplitude at crossover frequency" method by setting DEQ delay to 12.32ms (vs 10ms for panel), I measured delay of 102.271ms

Calculation would have then indicated I should have set the bass DEQ delay to 8.44.  However, I included another bass measurement which was 0.1ms less, and tried to average in my head, but ended up miscalculating and dialing in 8.72ms.  However, as it turned out, determining the bass adjustment is hard within +/-0.4ms or so because of low frequency room noise, and 8.72 bass vs 10.00 ms panel seemed to work out just right in subsequent measurements.  Here are the 3 bass measurements I did after the adjustment, and you can see they bracket the panel delay of 98.396, with the last measurement falling on that number exactly.  I decided that was as good as I was likely to get it.


BTW, you might notice the phase lead for the bass is also around 4ms, so if I had consistently aligned tweeter and bass to the beginning of the phase lead, at least as shown in these photos, the results would have been the same.  It is not always this clear.  However that method doesn't work with the tweeters which show no appreciable phase lead only a few 1/100ths of a ms of pre-ringing.  Also it's hard enough to see clearly the beginning of the positive rise, the beginning of the phase lead is in many cases hard to see clearly as it is obscured by low frequency room noise.

I dialed in the 0.06ms correction for the tweeters, and they now also lined up with the panel at 98.396:


Now adjusted to 98.396ms delay, all three drivers together (left channel) look like this:

Left Channel

Ignore how the leading transient looks like an M.  The second hump of the M is really the chair reflection.  Then what you see is that the positive transient of the bass blends into the decay of the positive transient of the panels, a little late to keep the top of the summed response level...but the fact that it doesn't even go negative first is an accomplishment.  The bulge of the bass transient peak is about 4ms later than the leading peak of the tweeter.  I believe this is the "most correct" alignment.  (I experimented with many other alignments in at attempt to keep the top of the "M" level but could only make it look worse.  But I haven't done those measurements yet as they should be done...with the chair out of the way.)

The fact that this 20ms pulse doesn't look square all the way across the top is probably mostly due to room reflections.  But if you let your imagination wander, you can still imagine the 20ms pulse, with the leading and trailing edges marred mostly by the chair reflection which makes them look like an M instead of an I, but otherwise looks remarkably good for an acoustical measurement in a small room.

Measuring the impulse response using sweeps, then calculating the frequency response and distortion, I got this:


Now the crossover frequency at 125 Hz may be close to the bottom of a tiny dip.  But the amazing thing is how tiny that dip is.  From 50-150Hz we see nothing but tiny wiggles around a gradual decline.  This is far better than previous measurements, which typically showed a 10dB or larger peak centered at 150 Hz, which happened to elevate the magnitude at 125 Hz, and possibly a 10dB notch between 90 and 110 Hz.  The tiny wiggles represent the tolerances of my fine tuning the bass response with digital EQ, without which there would be huge peaks and suckouts.

In fact, this is the best measurement I've ever seen in ARTA, with a smooth decline across the spectrum until the tweeter rise prevents total drop.  Distortion looks a bit higher than I'd like below crossover frequency, but this may be largely a result of room noise from the air conditioner running near maximum with outdoors at 105F.

The two previous alignments showed that if the microphone is centered, everything in the right channel measures the same, except the right sub is about 0.32ms delayed because it's farther back.  So I dialed in the same values determined for the left channel with that 0.32ms less for the sub, or 8.40 (vs 8.72).  Then did a measurement of all three drivers in the right channel:

Right Channel
Right Channel

The droop between the panel spike and the peak from the bass is just a bit deeper.  Then I turned off the panels just to look at the sub and tweeter.

It's a bit hard to see where the bass actually starts rising...but actually it seems to start rising at the exact moment after the pre-ringing of the tweeter, though the bass only rises slowly at first so that part might be the tail end of the phase lead.  It's possible the bass would best be moved forwards about 1ms because my previous alignments were not correct.  I was tired of doing these measurements in the presence of obscuring room noise and decided that, for now, this was good enough.

Then, I finally tried moving the chair, and so the M artifact went away, giving a somewhat cleaner looking impulse response where you can see leading and trailing edges pretty well, just some reflection stuff in between.  I showed this picture in a previous post without explaining all the work that went into making it:


You might think that moving the bass fowards in time (by setting less delay in the DEQ) could make the top of the transient just past the initial rise say risen longer.   Earlier measurements of this were inconclusive, it appearing difficult to do much better than this, either in removing the gap between first and second peaks, and in the pulse staying positive as long as possible.  A systematic exploration of this might be interesting.

But meanwhile I was seriously bothered by the phase lead issue, and in my head (not having seen all these measurements together) I was thinking the panel phase lead was far shorter, and so if I aligned all drivers to the beginning of their phase lead, if any, I might get an actual "better" alignment, more like I had gotten using the maximum output at crossover frequency method.

So instead of trying to optimize the right channel any better, as I had done for the left, or exploring the transient shape with different delays systematically, I then started investigating the phase lead phenomenon electrically, to be described in the next post.


Saturday, August 15, 2020

The Final and Ultimate Time Alignment method

Q: When is it done?

A: When I'm fed up trying to make it any better.

I think I've finally figured out why my 3 time alignment methods don't match.  It's very simple.  My speakers do not have perfect phase response.  Added to that, my room is not an anechoic chamber, so anything past the first reflections is potentially changing everything past that reflection.

So assuming there there are errors in phase response in either speaker driver at the crossover frequency, those will mean that if you dial in the actual correct time alignment, the magnitude of the frequency response at the crossover frequency will in fact not be maximized.  It would only be maximized if there were no phase errors and no reflections, or if in some chance the phase errors happened to cancel out and no applicable reflections.

That problem is going to affect the cancellation method also.  Phase errors mean that you will not get perfect cancellation at the correct alignment, but instead you may get better cancellation at some other relative delay which is not the correct alignment.

Now, the full on approach to fixing this is applied by many tireless audiophiles like Linkwitz, who carefully measure the phase response for each driver, and meticulously perfect the phase response of each driver as much as possible with electronic EQ, either immediately before, after, or within the electronic crossover electronics.

I am not going to be using that full on approach in the immediate future.  And especially I am not going to be measuring the phase response and having some computer program compute the ideal inverse (as is standard practice today in home theater and the fancy room equalization).  My approach is to avoid adjusting to exact measurements, because measurements are never exact or fully revealing.   Companies that cook up automated measurement systems put in many person years of research and development time, and it still isn't perfect or perfectly reliable.

Instead, I believe in compensating to the model, not the measurements.  Actually if you read Linkwitz you see this is exactly what he does.  He figures out what is happening by combining lots of measurements and his understanding of relevant theories, then uses that to model of the drivers or whatever, and then compensates for that model.  That's a lot of work and at this point I do not understand anything well enough to model it very well.  My attempts to fix things are currently based on a best first approximation.

So it is, then, that having studied several alternatives, it now appears to me the best way for me to do a time alignment is pretty much the simple and intuitive way.  I align so that the wavefronts from each speaker arrive at the listening position at the same time.  This is where the current time alignment project started, and then I took detours exploring two alternatives I though might give more precision, but instead they just provided more confusion.

This is only complicated a little bit by the fact that the wavefronts themselves have artifacts.  The output of every speaker seems to have phase lead and/or digital pre-ringing.  The phase lead is possibly caused by the high-pass characteristic of each driver.  None goes to DC but some go deeper than others.  The subwoofer has by far the longest phase-lead because it has the lowest high pass frequency.

The first best approximation is to align each wavefront at the beginning of it's large positive polarity response to a positive transient impulse signal.  (Assuming the drivers are all in-polarity, as mine are, otherwise use the first large negative polarity response.)

That's it.  My examination of both the maximum crossover frequency cancellation method, and the maximum crossover frequency summation method, has revealed to me that neither can be used unless your driver phase responses are something like perfect.  Good luck with that.  Otherwise, they just lead you astray.

This is actually good and useful, because it means time alignment can be done fairly quickly and efficiently as compared with the nearly exhausting summation and cancellation methods, where you must do a large number of tests to zero in on the best summation or cancellation.

The kind of alignment I now recommend could be done with any simple device that generates a transient pulse and records the following sound output--for which a microphone and storage oscilloscope would work.  It so happens I have a fancy FFT based analyzer that can do this as well as endless other tricks.  But most of the tricks are useless for this simple alignment, except as a cross verification that you haven't messed other things, like the frequency response, up too badly.


Wednesday, August 12, 2020

Yet Another Time Alignment?

After having done 3 time alignments in the past month or so, you'd think I'd be done.   I had done the previous one on Saturday August 8, and wrote it up in this blog on Monday August 10.  But by August 11, I found more evidence it was wrong, and began doing the one I will report below.

I was unsure of the previous one from the beginning.  Covering the range of 1.32ms to 11.32ms delay for the woofers in 2ms steps, and as compared with a fixed 10ms delay I apply to the panels, I expected that because of the 8ms period of the 125 Hz nominal crossover frequency, I would found two peak summation points in any 10ms range.   Indeed I did, at 5.32ms and 11.32ms.  One curious thing was that the second one, at 11.32ms delay, which is 1.32ms more delay than the panels, I measured the highest summation point of all.  But I wrote that off as random noise and chance.  It was just chance, I surmised, that the second point happened to be closer to the true optimum than the first.  I believed that if I found the local optimum close to 5.32, it would be as good or better.  Call this the difference in local optimality theory.  This theory was somewhat supported by the fact that 11.32 - 5.32 = 6, which is not the expected 8 difference between local optima.

I then looked at the possibilities between the first maximum, at 5.32 ms, and the closest second, at 3.32 ms (which had been the "time alignment" of a week ago) and found an intermediate delay time which gave the highest best crossover magnitude in that interval: 4.86, which is 6.46 different from 11.32, still not 8.

This new 4.86 ms delay adjustment still did not yield summation as large as 11.32 ms, and I could not write it off to a difference in local optimality, in fact now it looked like even 11.32 was not the actual local optimum, but probably something more like 4.86 + 8.

But with a few hand waves, I wrote this off in my previous post.  I argued that you could never tell which of the many possible local optima was the true correct value by its magnitude alone.  I argued you'd need some entirely different way of doing that, such as by examining the transient stimulus delay time for each driver.  And I had already done that in previous tests. I asserted.

That was before the more careful record keeping I've started to do.  I couldn't exactly remember the numbers had come out, I might have made mistakes, and other things might have changed.  For one thing, I couldn't remember the delay time settings at the time I did the first transient stimulus tests, since I began adjusting them without writing down the starting values.  It was carelessness at first, but then I thought at the time, "well it doesn't matter now that I've got the ultimate standard, the first detectable response to a transient pulse input, who cares what the earlier misbegotten values were."  Only later I discovered that first detectable response method wasn't necessarily the ultimate standard after all, or so it seemed, and I then did a cancellation method alignment, followed by a summation method alignment. Each one seemed to raise more questions than it answered.

And now I even suspect that I made some mistakes not knowing that ARTA puts out a negative transient pulse, which confused the interpretation of some graphs.  Also for several days I deliberately had the panels out-of-polarity (for the cancellation tests), but nevertheless treated respectfully the apparent "improvement" in plus coherence as I approached the apparent optimum (by the cancellation method).

Anyway, considering my hand wave about entirely different ways, I decided it was time I go back and try the transient stimulus test all over again.  The panels showed a total delay of 97.5ms (mostly caused by the FIR filtering).


Notice I have corrected the polarity using the ARTA "invert on input" option.  Actually I measured the bass beforehand, but I believe I also had the "invert on input" option selected (though, I find the user interface on the ARTA so weird that I am constantly shutting it down by accident, and then on restart some options gets saved, and others lost).


Nothing in particular seems to start at 97.5 ms, however a downward inverted signal starts around 98.or so.  But I was still discounting that as "phase lead," what counts is where the positive phase begins.  On a lumpy shape like this, I'm not sure where to start that, but it would be at or somewhat beyond the lowest point, which is 108.7ms, which seems about 11 ms too late.  This strongly suggested to me that I was delaying the bass too much, though I admit now it's somewhat ambiguous.  The point of first movement is actually fairly near that of the panels.  (But bear with me.)

I captured the issue better in a later measurement, in which I played the woofers and the supertweeters (which are visually very well aligned with the panels).  Here you can see quite clearly that the tweeter signal is occurring AFTER the woofer has already begun, and by at least 6 ms.  (The curious second HF burst is the downward portion of the 10ms transient impulse.)

10ms pulse with 5.32ms subwoofer delay


OK, now I tried the second value where I had observed a maximum, but without searching for a local optimum.  That was 11.32 ms delay for the woofer (compared with 10ms fixed delay used on the panels).

Subwoofer pulse with 11.32ms woofer delay


I believe this is looking better.  I expanded the Y axis a bit for clarity.  The supertweeter leading transient occurs at exactly 97.6 ms, which aligns with the panels.  It has a smaller reflection at about 99ms, possibly the chair, so ignore that for now.  The bass clearly begins about 2 ms later, at around 100ms, with a positive cycle.  Perhaps if I expanded the Y axis much more, I would see it go back closer to 97.5ms.  Anyway, this sort of makes sense as a near-alignment, possibly in need of about 2 ms fine tuning.  By comparision, the previous graph makes no sense as a near alignment.

To fix the alignment, my method was the same as I used for the 5.32 tentative local optimum, but now applied to the 11.32 tentative local optimum.  I would measure the frequency response at 11.32, noting the magnitude at 125 Hz.  Then I would add or subtract some small increment, enough to make a measureable and hopefully reliable difference.  If it showed higher magnitude, I would continue in that direction with the same increment.  From my existing knowledge of the repeating maxima every 8 ms, I suspected that the optimum was very nearby, so I would most likely not have to make too many measurements, and the denser measurements would also provide a kind of redundancy, reducing the effect of noise.  OK, this was a slightly different method that what I did the previous time.

Response with 11.32ms sub delay


This 128.79 dB magnitude was already better than the best magnitude I measured before at 4.86, and the overall response is remakably smooth from 20-10,000 Hz, it closely fits a slightly sloping line.   Also the distortion remains low from through the bass, as if the subs were just an extension of the panels.

Thinking mostly of how the  local optimum here ought to be about 8ms different from the previous one at 4.86ms, I guessed upwards would be the way to go (though this contradicts the graph above, I see now).  Anyway, my guess appears to have been correct anyway, magnitude kept rising as I kept adding more delay in 0.2ms increments.

Response with 11.52ms sub delay


Magnitude at 11.52ms has risen notably to 128.96dB.  Increasing magnitude appeared to be the way to go, so next I tried 11.72 ms.

Response with 11.72ms delay

At 11.72ms, the magnitude has risen even more to 129.23dB, further confirming we are going in the correct direction.  So I tried 11.92.

Response with 11.92ms delay

11.92 ms delay was better still at 129.32 db, so on to 12.12 ms delay.

Response with 12.12ms delay

12.12ms  was better still at 129.35dB.  So on to 12.32ms.

Response with 12.32ms delay

A second very small improvement at 129.37dB, but off to 12.52ms.

Response with 12.52ms delay

At 12.52ms delay, there has been a sudden small drop to 129.33ms.  This suggests the optimal point is less delay than this.   At this point we could try 12.42 or 12.22, the intermediate points surrounding the previous high value.  I decided to try 12.22.


12.22 ms delay gave the best magnitude of all, at 129.41dB.  There seemed little point in trying 12.42 since the two points upwards from this measured worse (although we are well into the territory where noise matters...it's amazing that I can measure these incredibly tiny differences in the first place!)  I could try to fine tune the delay around 12.22, but it would be hard to tell improvements from noise at this point.  So I decided to choose 12.22ms delay as the final value.

It was much more important to me to be sure that THIS was the correct "peak crossover magnitude vs subwoofer time delay" peak to optimize.  I still wondered a bit if the previous one near 4.86ms was actually more correct.  I now wanted to do other kinds of tests to verify.  First I took a look at the transient time response with at 20 ms pulse.


3 way response to 20ms transient

Ideally, what this would look like would be an upward spike at 97.5ms followed by a flat line, then a downward spike back to baseline at 117.5ms.  The rough looking lines are the supertweeter response, and they occur about where they should be occurring.  In between, instead of flat line there is some bass resonance possibly mostly driven by acoustical room reflections.

Still, looking at this graph, you might wonder if the optimal sub delay would be about 4ms less, then the rolling peak of the bass might occur where the inital response is collapsing.  However that would be nowhere near a peak magnitude at the crossover frequency, AND in all my adjustments I have never seen the "M" figure corresponding to spikes go away.  I have been figuring that to be caused by local reflections around the microphone, possibly the listening chair, which I did not move out of the way for these tests (it's not easy to do because there's not much extra space in the living room, and arguably it should be there to reflect the "real world" listening experience).  That the second M is upside down is correct, since the first is an upward spike and the second is a downward spike.  However clearly the downward spike is obscured in the measured response by bass reflections already underway.

I repeated the transient test with the panels turned off for more clarity.

Sub and Tweeter response to 20ms transient

This does indeed show the sub response starting to rise significantly past the tweeter response.  However it's still unclear if the sub has started to respond at the same time as the tweeters, possibly with an out-of-polarity segment.

The next day I ran frequency response analysis on the two peak magnitude candidates, the current 12.22ms delay  and the earlier 4.86ms.  I tried to do these more carefully, and by running them back to back unwanted extraneous influences are minimized.

Response with 12.22 ms delay

Almost identical to the one run previously, now with an even higher magnitude at 129.43dB (0.02dB higher).

Response with 4.86ms delay

When all is said and done, it's remarkable how similar these are, despite the nearly 8ms difference in subwoofer delay.  I see no reason in the frequency response to prefer the 4.86 to the 12.22; they are virtually identical.  The 12.22 has slighly lower distortion though the subwoofer range, though possibly a hair more distortion in the 150-250 Hz region (where the 4.86ms delay has very slightly more output).

I still felt insecure about electrically delaying the subs more than the panels, so another day later I decided to compare 4.86 and 12.22 some more.  First I did a transient with tweeter and woofer at the 4.86ms subwoofer delay.

Sub+Tweeter transient response at 4.8ms sub delay

This looks wrong.  The supertweeter is starting right at the crest of the subwoofer response which started about 8ms earlier.  The falling subwoofer wave should take the stuffing out of any transient longer than a few ms.  For the 12.22ms delay, I cranked up the X axis to see more clearly

Sub+Tweeter transient response at 12.22ms sub delay
Add caption

Now this seems to make more sense.  It seems like the sub and tweeter are almost starting at the same moment (possibly the sub is starting a fraction of a ms sooner), but the sub is starting with a slight negative phase lead which then goes strongly positive a few ms later.  But was that apparent "phase lead" real or just room noise?  I repeated the sub by itself 2 times and got an identical transient response each time:

Sub transient response at 11.22 ms sub delay
Sub transient response at 11.22ms sub delay

It's clear that there is a consistent negative phase lead extending about 5ms in front of the positive sub response, regardless of the preceding noise, and this negative phase lead starts at about 97 ms, possibly 0.5ms earlier than the tweeters and panels, though it's hard to tell exactly because of the random noise.

I'm now fairly confident that the 11.22ms alignment is better than the 4.86ms alignment, but possibly there is an even better alignment in between, that would result in a more square looking transient, but lower magnitude at the crossover frequency.

Monday, August 10, 2020

Positive Time Alignment

This past Saturday, I intended to do a "final" (for now) measurement of the actual frequency response resulting from the latest time alignment in the left channel, and then check if the right channel was up to speed now also (which hasn't actually been tested in awhile, I just apply a known correction to the left vs right subs, the other speakers are sufficiently physically centered according to previous measurements).

One look at the results, however, left me wanting to do another check.

Remember that I had adjusted the subwoofer alignment using only out-of-phase "impulse response" sweeps that get converted to frequency response by ARTA.  When the alignment is correct, so the theory goes, there should be maximum cancellation at the acoustic crossover frequency.

There are several problems with this in practice, however.  The first is that the acoustic crossover frequency will likely differ from what was dialed in electrically.  (The acoustic crossover function may differ as well!  It surely won't be a perfect LR8 or whatever, unless all other influences, including room modes and driver resonances, are compensated for.)

OK, I thought I had a handle on that last time.

The other problems are that the resolution of ARTA even with 256k samples, is that the bass resolution appears to be quite poor.   I seem to get much better bass resolution using the 1/6 octave mode of my iPhone RTA app.

I would have thought the samples corresponds to bins of the FFT analysis, but as writing this report, I discovered that there is a separate Bins parameter in the Analysis Parameters setup page.  I'll have to explore that later.  I have just now discovered that the Bins parameter was set to a mere 64k.  However that should still be better than the RTA app which only uses 16k bins, even if possibly covering half as many frequencies.  I noticed some other possibly relevant settings on the Analysis Parameters page, including the Window Function, which strangely defaults to the least selective Hann function.  It seems to me that even at that, I'm seeing less than I should.  64k bins over 48k frequencies is still more than one bin per Hz.

Anyway, for now just take it that the low frequency resolution is poor, and add to that there is a lot of acoustic noise.  I have never shut down my air conditioner (because I don't want to be shortening its life due to my audio madness) and though it is very quiet, it may still be noticeable (especially for morning and afternoon measurements, it is generally quieter in the evenings).  And various other background noises.  The noise level is such that making the same measurement over and over may result in as much as 1dB variation in a particular frequency.  So if you're seeking the deepest dip, and steering your search based on differences smaller than 1dB, there's not much assurance you are going to be steered correctly.

There seems to be a third phenomenon, but it may just be the effect of the first two I've just described.  That is, when there is a deep acoustic notch, caused by room modes or something like that, near the crossover frequency, sometimes the cancellation notch "merges" with the acoustic notch, in a sort of blob-like fashion.  I worry that in these cases the cancellation measurement cannot be assumed to only correlate with the crossover frequency time alignment.

Anyway, all those factors were in play, I now believe, when I did the time alignment in the days just before August 3.

The bottom line is that merely measuring for the best cancellation, either at the nominal crossover frequency or what appears to be (by maximum notch depth) the acoustic crossover frequency, can be misleading.

I'm not believing the reverse, that looking for the best summation is better.  And the best summation is not merely at the crossover frequency, but in an affected range around the crossover frequency, which may extend down to 1/2 of the crossover frequency on the downside, and 2x the crossover frequency on the upside.  That is the range that should be looked at in evaluating how well the crossover is working, and therefore how good the time alignment is (if that is the independent variable).

This was the starting measurement which got me worried:


In my then-way of thinking, the acoustic crossover is around 120 Hz, and that's where this shows a notch centered (though 125 is about half way up to a peak).  But what disturbed me more than that was the dip at 60 Hz.  Back in an earlier measurement (well, it was the one where the midrange was out of polarity) that 60 Hz dip had gone away, so I thought I had fixed it, and now it's back.

I wasn't thinking correctly, maybe.  That 60 Hz dip had gone away possibly because rather than in spite of the fact that the midrange was out of polarity in the bass.  So maybe I should have been ignoring that.  But anyway, if you draw a line between the peaks and dips, what you see isn't pretty, the bass is way down around 60 Hz, peaks about 135 Hz which is significantly above the crossover frequency, then goes generally downward all the way to 500.  I thought it should be much more level than that, on average.  I remembered it being much more level than that.  This looked wrong.  And maybe it was.

This time, I decided to be very systematic about measuring on a grid to get the overall picture of change over the range of interest, before searching to optimize between what appear to be the best grid points.  That way, I figured, I would not be steered in the wrong direction by the randomness of the measurements, which appears to result from noise and possibly other factors.

And by now I had figured out that there is not just one delay time that yields a maximum or minimum, but a series of points, separated by the cycle time of the acoustic crossover frequency.  So if the crossover frequency were 100 Hz, optimal points would appear every 10 ms, where you would get either maximum summation or maximum cancellation.  If my acoustic crossover is identical to my nominal crossover at 125 Hz, I would see repeats about every 8ms, which appears to be the case.

So the best way to keep from going off track is to restrict measurements to a 10ms interval.  I'm not entirely sure I have found the correct 10ms interval, but it can't be too far off, given my initial alignment of the "driver start time," modified by the fact that the bass apparently starts out-of-polarity with a phase lead.  So last time I started from the point where the bass response to a transient starts going in the in-phase direction, and lined that up with the positive phase of the panel response, before optimizing around the crossover frequency.

Then, since there is a known interval, we can set grid points at some considerable distance, but still within that interval, and not worry about being cast far astray because of lack of convexity in the "delay time" vs "peak response" function.  Within every 8ms range there should be one optimal point, and everything else should be worse than that one point, unless the optimal point is at one end of the interval, and then the second optimal point should be at the other end.  This regularity makes gridding a useful method.  If the function were non-convex, in the presense of noise we'd have to sample every single possibility.

The previous adjustment was 3.32 ms delay (relative to 10 ms delay for the panels) so I started just below that at 1.32ms delay, which gave this curve:

1.32 ms subwoofer delay, note crossover suckout

Here the likely acoustic crossover has nearly been sucked into a depression, so I think this is wrong.  Magnitude at 125 Hz is 119.48 db.  (Note these numbers are way too big because my Focusrite level settings are not calibrated in ARTA.  But the numbers from successive tests will be comparable because I did not adjust the levels between them, because I knew that would throw everything off.)

Next I tried 3.32 ms, a repeat of the test I had done earlier in the day


125 Hz nominal crossover frequency is now halfway up a peak, with a magnitude of 125.37 dB.  Progress is being made!  Onward to 5.32.

5.32ms subwoofer delay

I noticed that 60-300 Hz appears now appears more level to my averaging eye than anything seen before.  The dip at 60 Hz is now pretty small, with the dip at 90 Hz larger (which IIRC is the way the sub measures by itself).  Even the reflection cancellation around 300 Hz is diminished considerably.  Overall a pretty nice looking response, with the worst feature being the dip at 500 Hz which has nothing to do with the crossover.  The magnitude at crossover frequency was 126.34, the best yet!


7.32 ms subwoofer delay

Things went from best at 5.32 ms to second worst at 7.32 ms, with a magnitude of 121.80 dB.  Only 1.32 ms so far was even worse, and the drop is so big it could not have been caused by noise.  Everything else looks bad also.  A large dip has opened up just above the nominal crossover frequency (is that the real acoustic crossover?).  Distortion in those frequencies has risen above 1% !   This is what  bad time alignment looks like, and just 2ms or so off the ideal.

It is now pretty certain that 3.32ms - 5.32ms is the optimal range, as those are bracketed by far worse performance at 1.32ms and 7.32ms.  But just to be sure, I kept on going.

9.31ms subwoofer delay

A corner has clearly been turned, and things are headed up again, but no where near another optimal range, with magnitude at 122.05dB.  However, otherwise, the bass looks on a fairly smooth downward tilt from 30 Hz to 300 Hz.

11.32ms delay

At 11.32ms I measured the actual highest magnitude I measured on Saturday night.  I could just barely complain about the response 200-400 Hz being somewhat weaker than usual, with the response from 60-100 Hz being their best, but considering the former more important.

But it should be remembered that 11.32ms is 8ms longer than 3.32ms.  What has happened is exactly as predicted, we have reached another optimal point 8ms longer than the first because 8ms is the cycle time of 125 Hz, the nominal crossover, which is probably very close to the actual acoustic crossover frequency.  It may be this measures slightly better because of noise, or perhaps because it is closer to the  local optimum it is closest to than 3.32.  That makes sense because it appears the acoustic crossover may be above 125 Hz, which would correspond to the cycle time less than 8 ms, which would mean the local optimum which corresponds to this one at 11.32 but nearest 3.32 is higher than 3.32.

There could be better points around these points, the real question is where those better points are, which may not be exactly 3.32 or 11.32 ms.

There has to be different method of choosing between the local optimum close to 3.32 and the local optimum near 11.32.  And that other method, so far, has been described, but should probably be doubled checked, and cross checked by other methods, and so on, in the future.  And so far, I've thrown in my lot with the true alignment point being in the range 3.32 to 5.32, because that fits closest to the aligning the initial upswings in transient response, which occurs around 2ms delay, and I had simply continued up to 11.32 to verify the cyclical nature of the local pseudo-alignment points by the maximum-output method.

But there might be a much better value between 3.32 and 5.32 than I had measured so far, so I proceeded to search for the optimum in that range.  I started with the obvious choice of 4.32 ms.

4.32 ms subwoofer delay


This is clearly better than 3.32 ms, and only slightly worse than 5.52.  Following general searching principles, I should then look between 4.32 and 5.32.  But instead, I was troubled by the possibility that it should be lower, because of the apparent optimum around 11.32.  So, instead, I checked 4ms.

4.0 ms subwoofer delay

I should have followed the general search principles.  This is obviously worse at 126.11dB, so it seems we need to look above 4.32 and not below.

5.0 ms subwoofer delay

Now this is better, the second best magnitude so far at 126.43dB, second only to the other maximum at 11.32 ms which is not in the correct zone by my reasoning.  The more logical place to look now would be between 5 and 5.32, but instead I looked lower again, at 4.7.

4.7 ms subwoofer delay

Lucky guess maybe, not we're up to 126.5dB, highest value so far in this region, and the bass is holding pretty tight tolerances from 50-300 Hz.

4.86 ms subwoofer delay

4.86 ms delay measured better at 126.51dB.  But that's a mere 0.01dB better.  What about in between?


4.78 ms delay

Weird, the point in between two high points is lower than either one.  But we're talking 0.11dB lower.  Remembers there's a lot of noise going on.  Clearly without getting rid of the noise, we can't zero in on the true optimum better than we are doing.  But also, this is pretty close.  The highest point yet is 4.86 ms delay, which is a mere 0.06 ms more.  And another lower point, at 5.0 ms, is only 0.14 ms higher.

I decided that the search has reached a sufficiently good point at 4.86 ms, though I suppose it could be very slightly better at 4.92 ms or something like that, it would be hard to know given the noise level.  I then re-measured 4.86 again.


2nd measurement of 4.86 ms subwoofer delay


Oops, the value at 4.86ms delay has fallen from 126.51dB to 126.44dB, illustrating the "noise" problem perfectly.  But I already decided this was good enough, it's seems within about 0.2dB of the optimum, and 0.2ms of the optimum adjustment, and it's hard to do much better without much more careful measurements, like shutting off everything else in the house, that I'm not willing to do.

You may also notice all the spectra from 4.7ms to 5.0ms look pretty similar and quite good in all respects, the bass response slopes downward from 20 Hz to 400 Hz quite nicely, with just a bit too much of a dip at 500.  The 300 Hz cancellation from rear wall reflection is hardly visible.

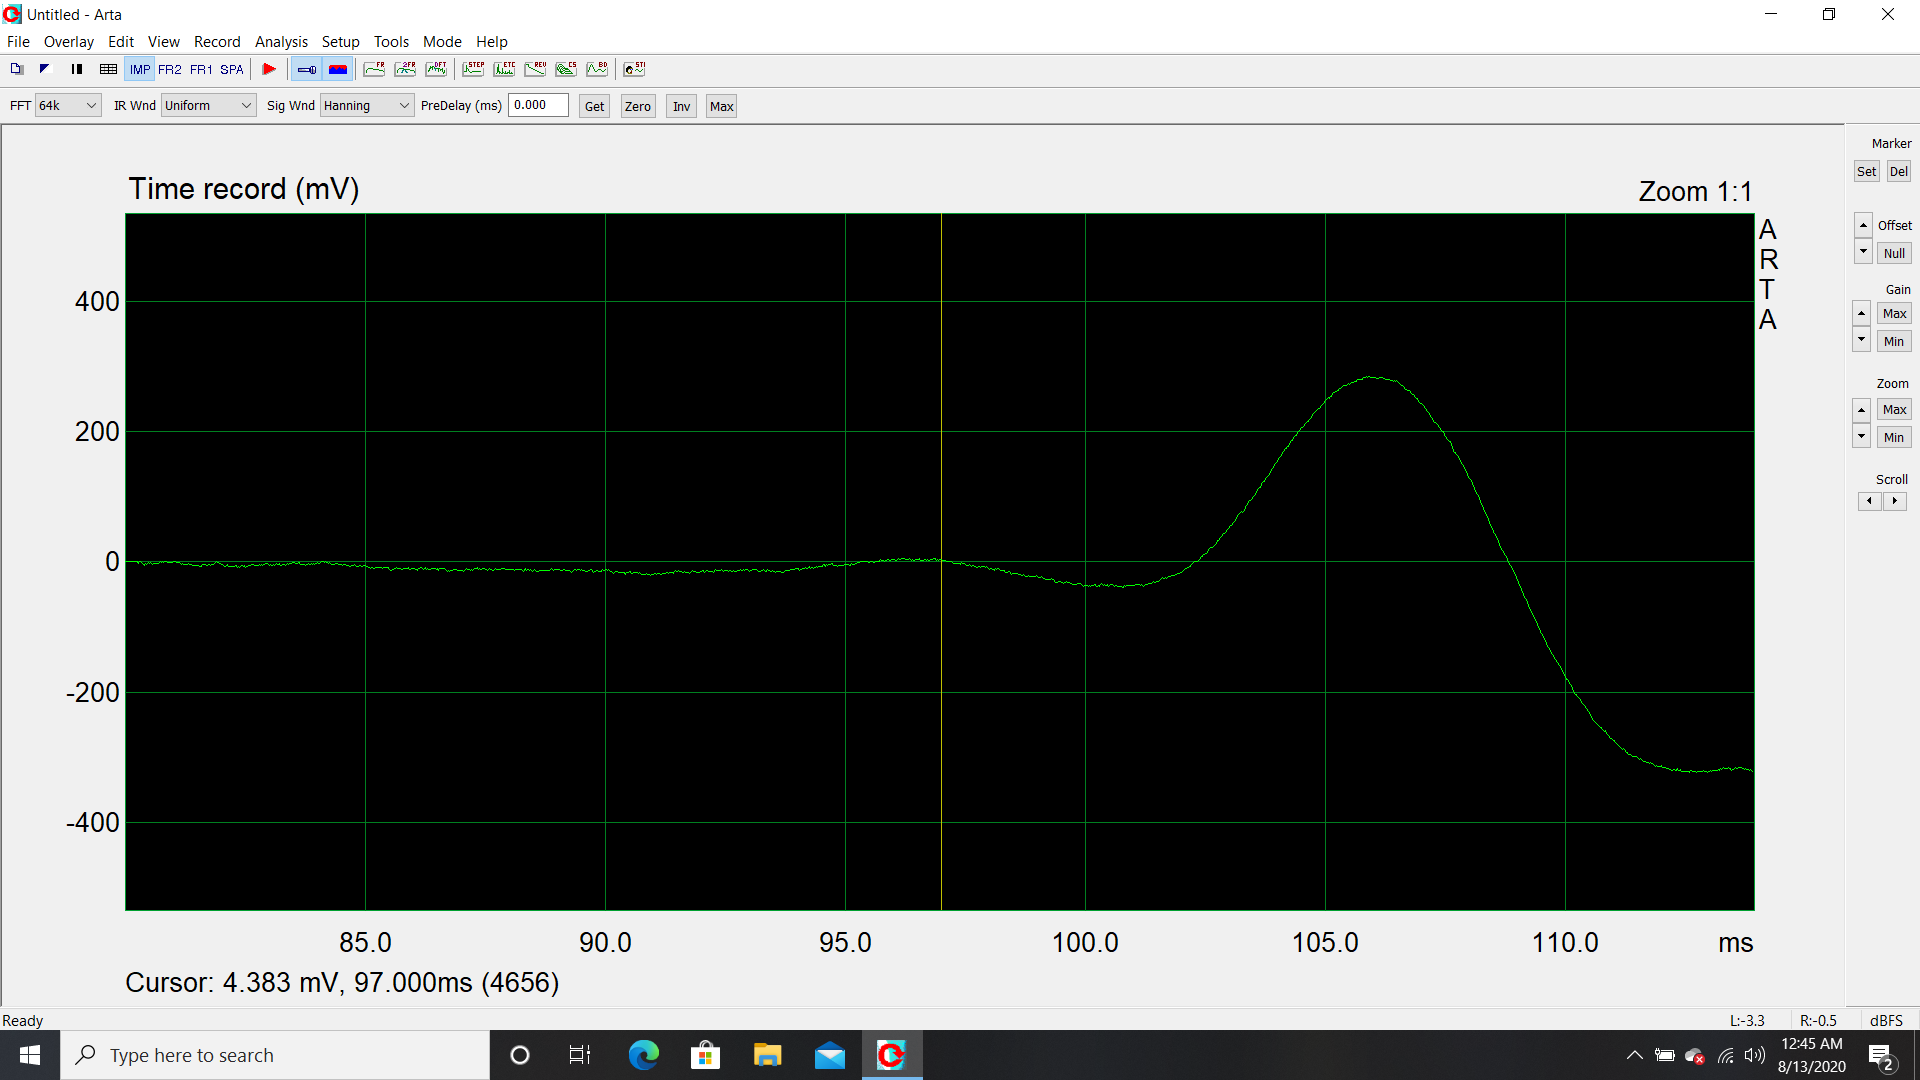
The time record, with polarity corrected, of a 2 ms pulse looks like this:


2 ms pulse

The first two ms look fairly pulse-like, with with everything pretty much in alignment.  I'm not sure why there appears to be a negative refection about 3 ms delayed, that could be the chair or some acoustic reflection.  I generally do not move the chair when doing measurements.